Marin July Real Estate Market Report

Marin County Real Estate
Stock markets hit new peaks; interest rates hit multi-year lows; unicorn IPOs roll out in San Francisco; an active spring selling season in Marin with median home sales prices about the same year-over-year
July 2019, Q2 Market Report
Median Home Sales Price Trends
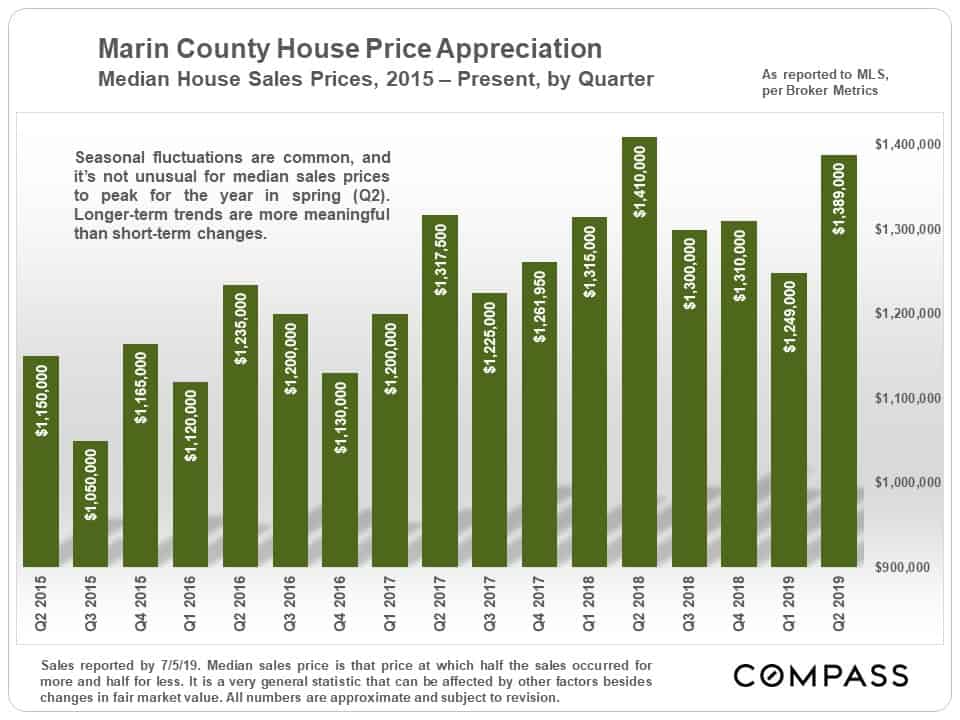
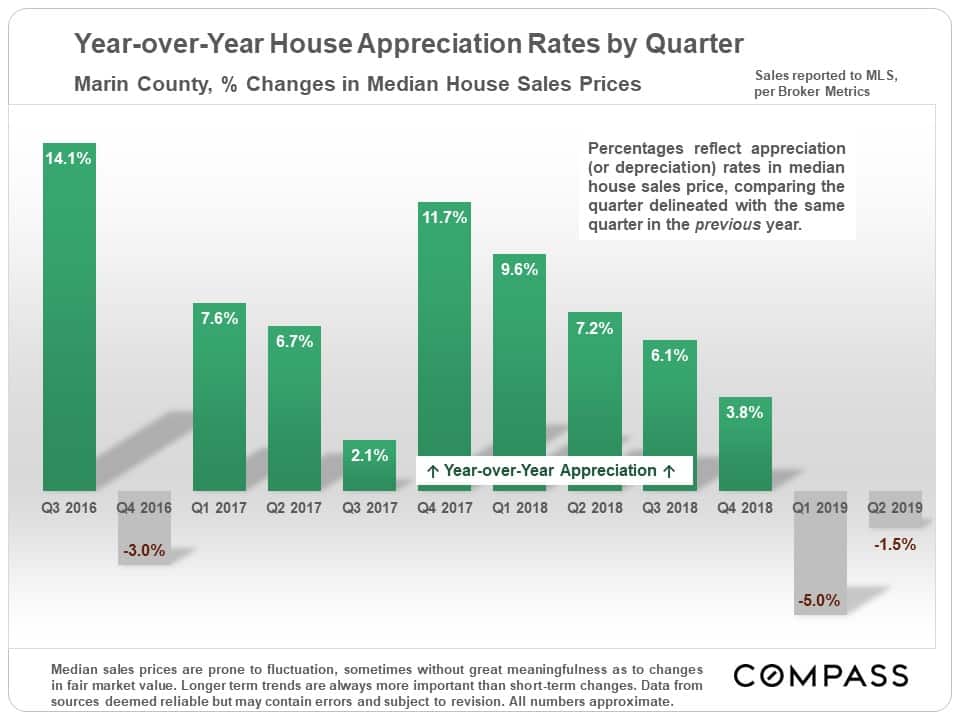
The 1.5% year-over-year decline is not significant since median sales prices are generalities and often fluctuate. The bigger story is that year-over-year appreciation, for the time being, appears to have stopped.
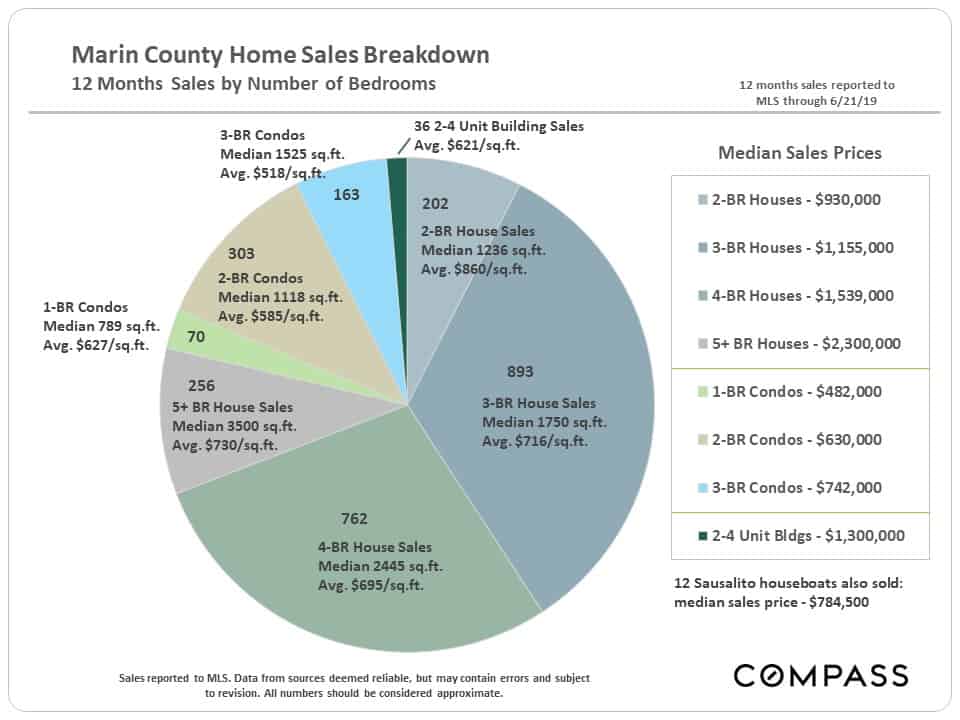
Home Sales by Property Type & Bedroom Count
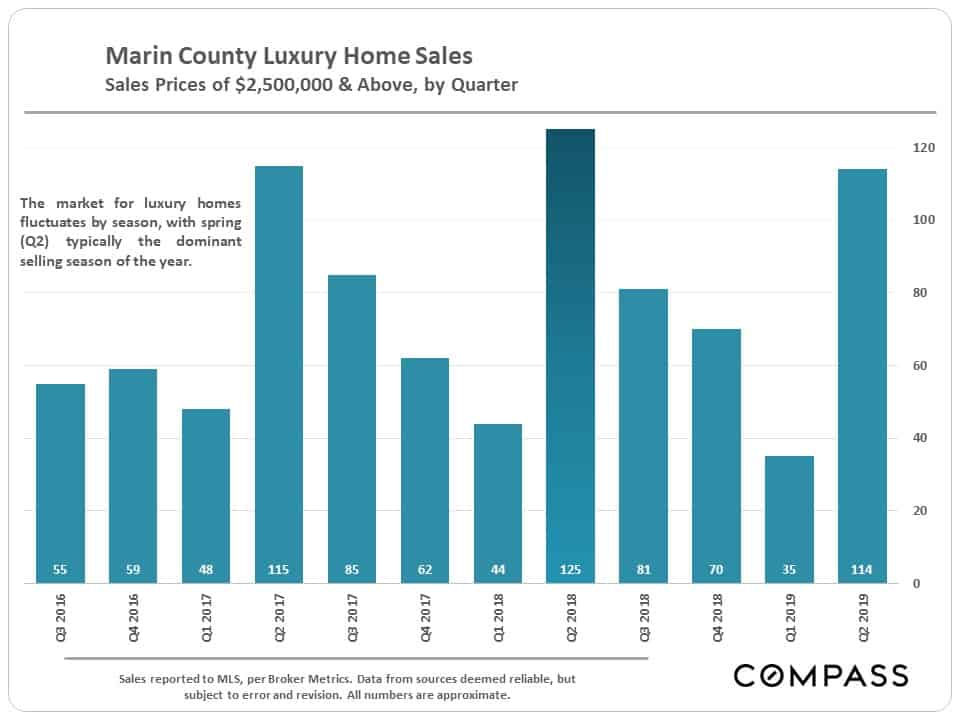
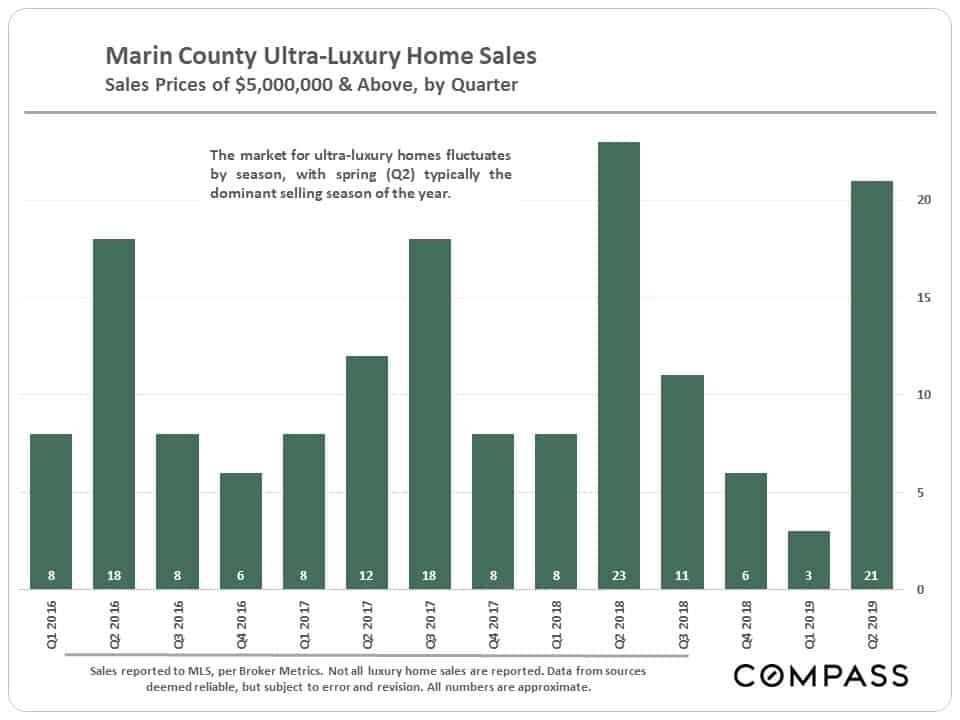
Luxury Home Sales
A strong spring for the Marin luxury home market, but not quite as active as last year in Q2 2018.
Selected Indicators of Buyer Demand
& Market Seasonality
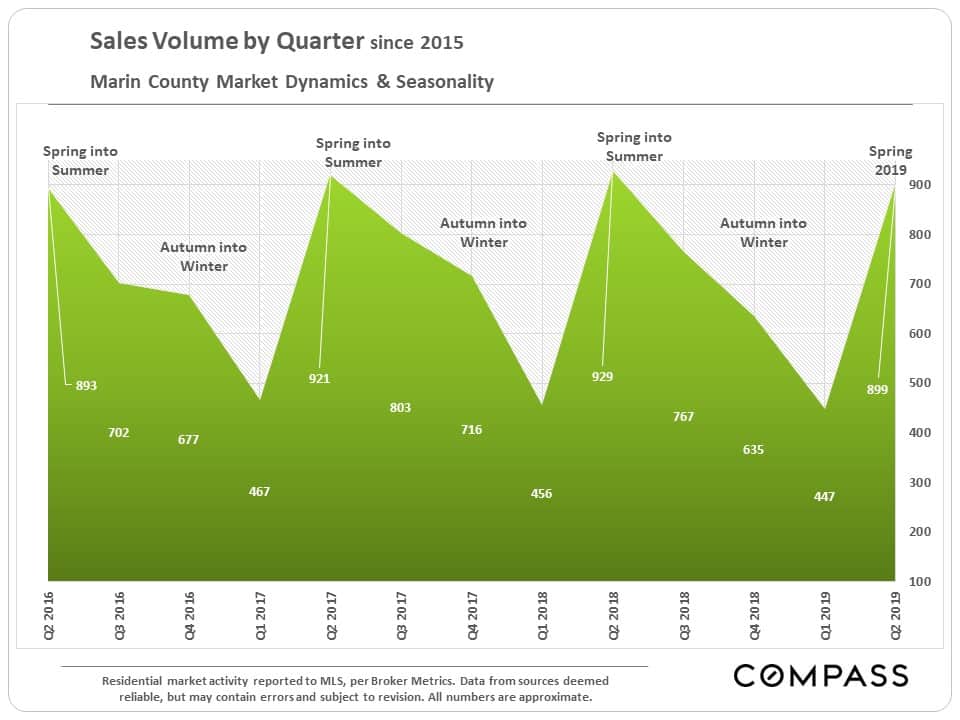
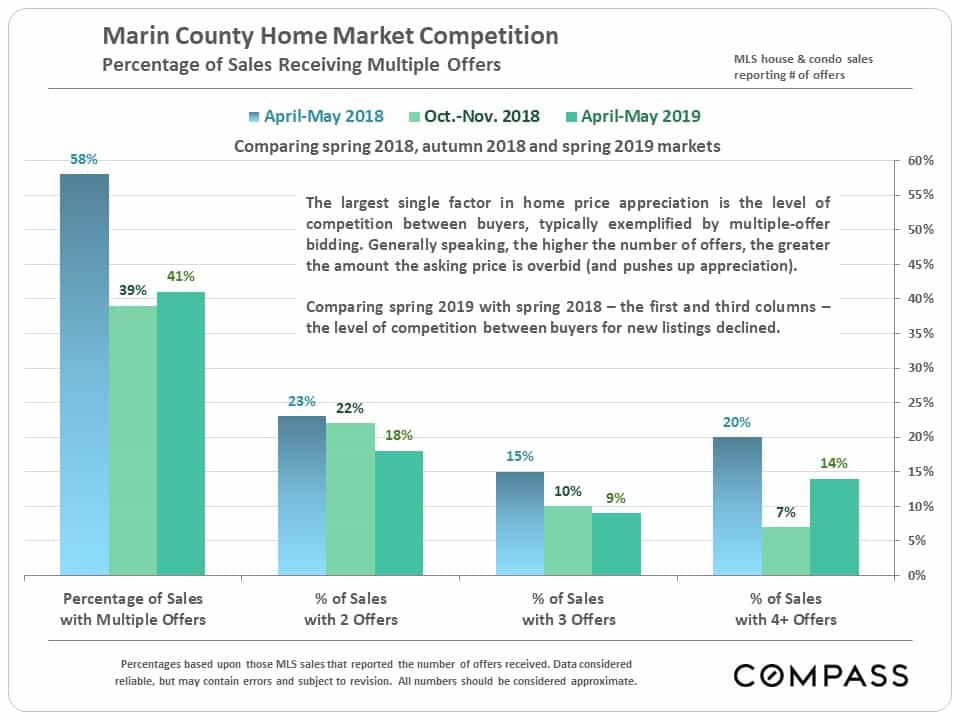
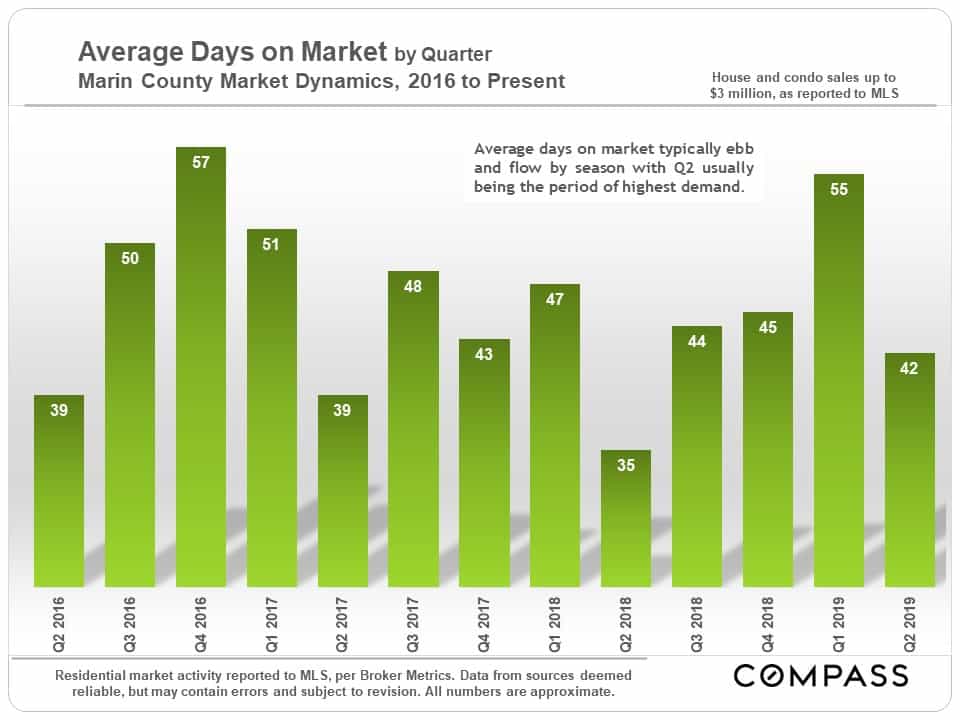
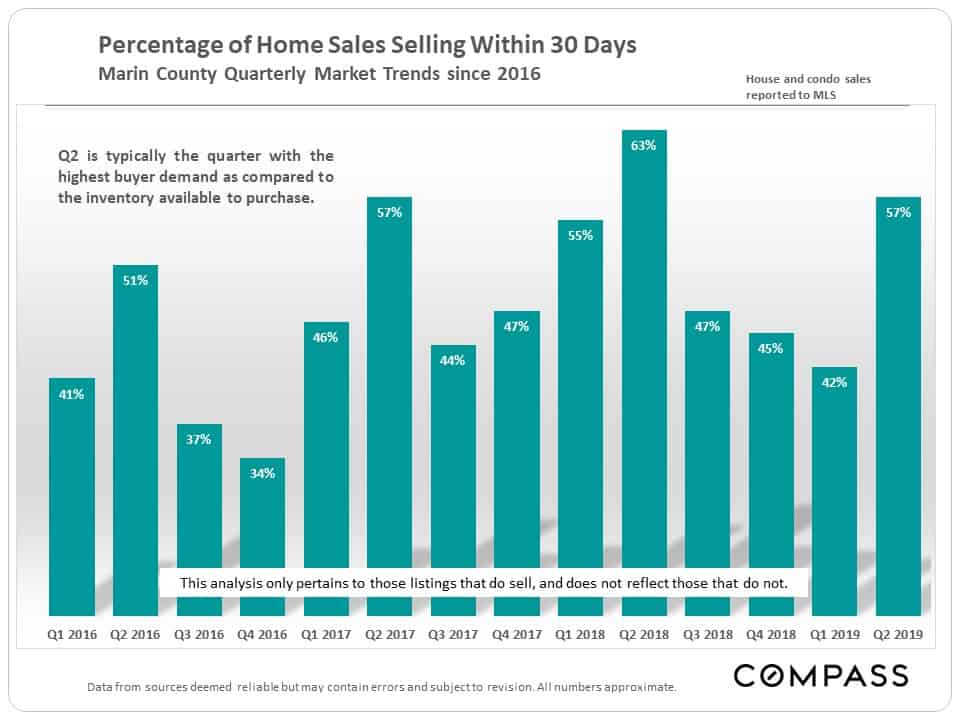
In the next series of charts, 2 points generally stand out: Buyer demand considerably strengthened during the spring selling season as compared to the previous 2 quarters – which is a normal seasonal trend. And spring 2019 was not as competitive a market as spring 2018 – which was a common dynamic around the Bay Area (though San Francisco’s market was quite feverish, probably due to all the local IPOs).
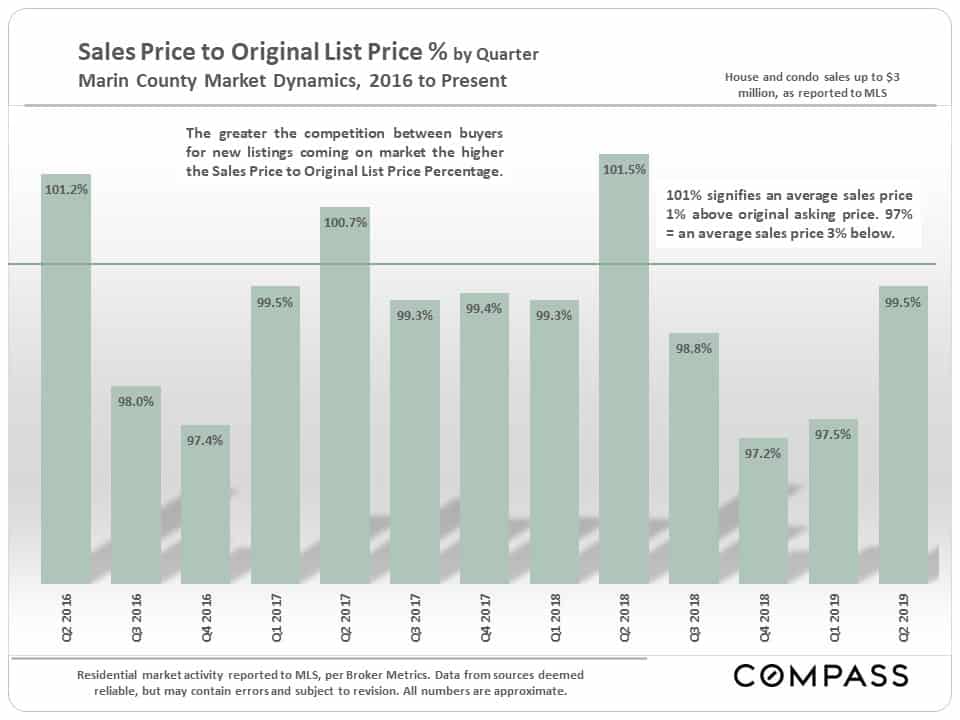
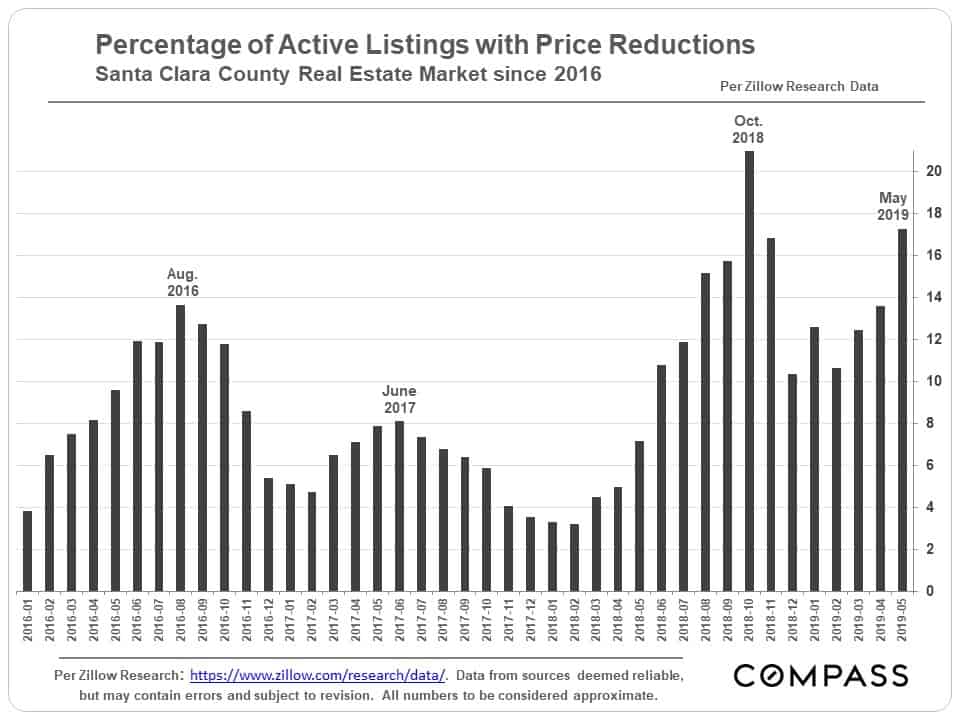
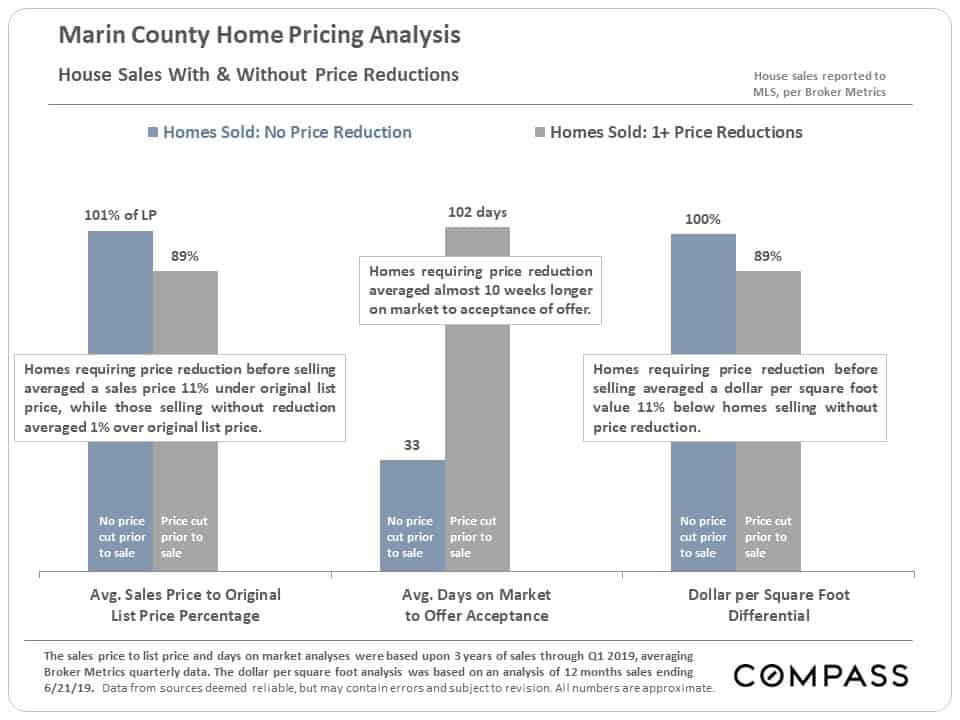
In many ways, the market is always divided into two parts: Listings that buyers react to quickly and positively (and often competitively), and listings that do not compel that degree of attention. Of course, there can be various reasons for the latter case – sudden macro-economic events such as financial market volatility, a lack of preparation to make the home look its best, inadequate marketing efforts – but the most common factor is pricing the home above what buyers consider fair market value.
Overpricing: Negative Effects for Sellers
& Opportunities for Buyers
We performed longer-term analyses of the effects of overpricing – as indicated by the need for price reductions before the property sold – on every major market in the Bay Area and the results were uniformly similar. As would be expected, there were dramatic differences in the sales price to list price percentage and time on market before sale. But there were also very substantial differences in the average dollar per square value realized upon sale. This is almost certainly due to missing out on the sales-price-enhancing effects of buyers competing for new listings they deem well priced.
So, overpricing lowers values for sellers, which also signifies opportunities for buyers who keep an eye out for price reductions and react accordingly.
We not only mapped Bay Area median house sales prices, but ranked them, lowest to highest. Unsurprisingly, certain Marin, San Mateo and Santa Clara cities, and various San Francisco neighborhoods dominate the upper end. If interested, click on the button link below: The ranking list can be found below the map.
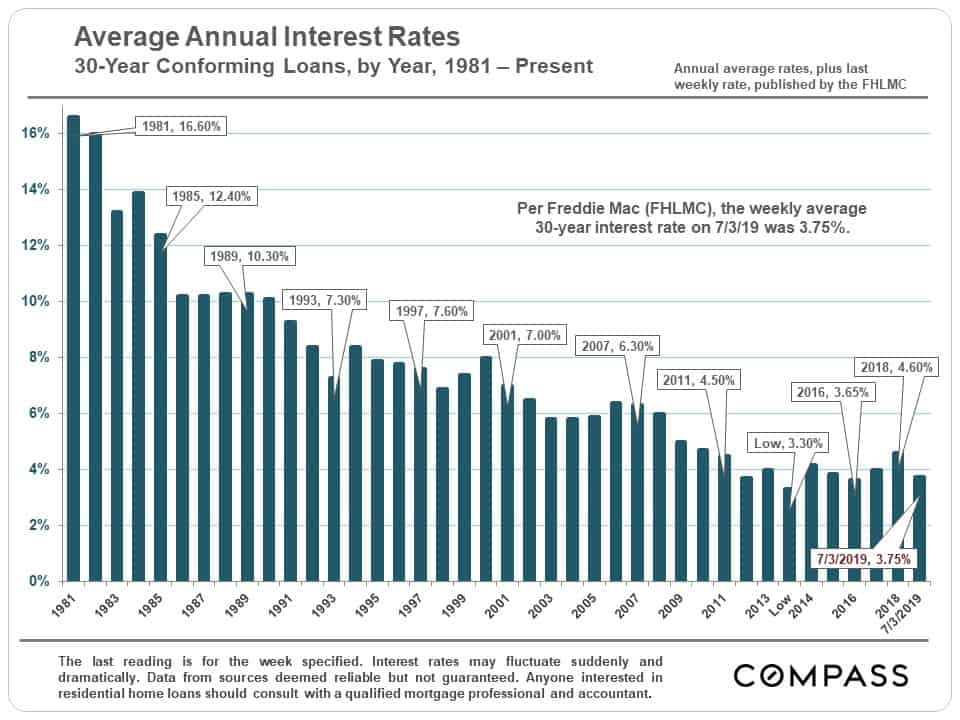
Mortgage Interest Rate Trends since 1981
2019 saw a stunning drop from late 2018 with a very significant effect on housing costs.
