Santa Clara County May Real Estate Market Report
Santa Clara County Real Estate
May 2019 Report
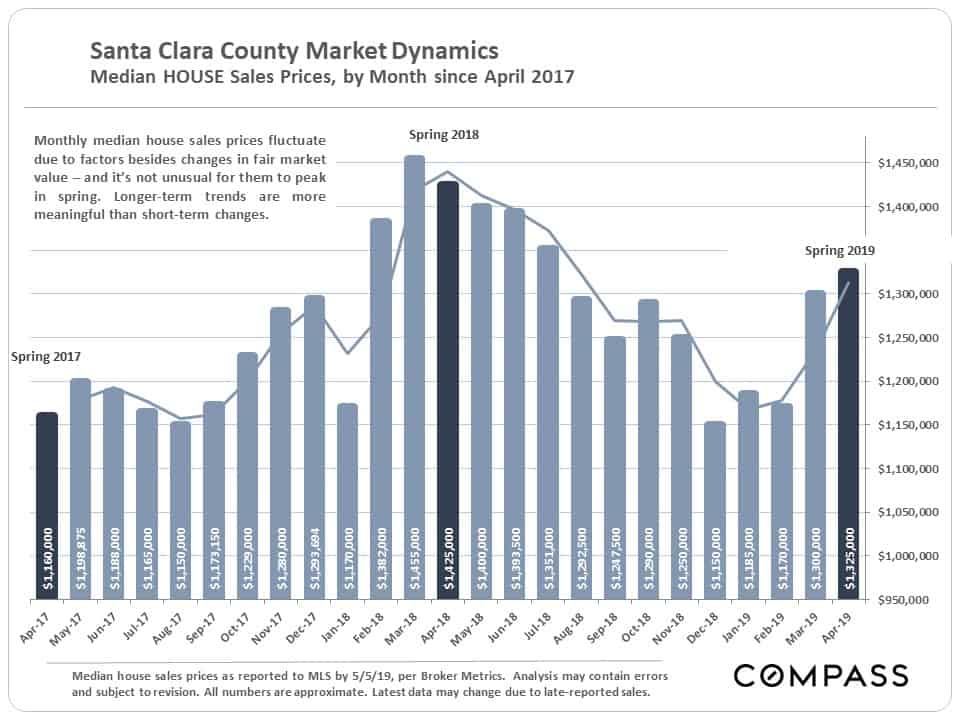
With April’s end, we now have 2 months of spring selling season data unaffected by market activity at the end of 2018, when financial markets plunged. As of early May 2019, stock markets have recovered to hit new highs, and interest rates are far lower than last year’s peak. However, so far, neither median sales prices nor the level of market activity have returned to the peaks seen during the ferociously hot market of spring 2018.
Monthly Median House Sales Prices – Two Years
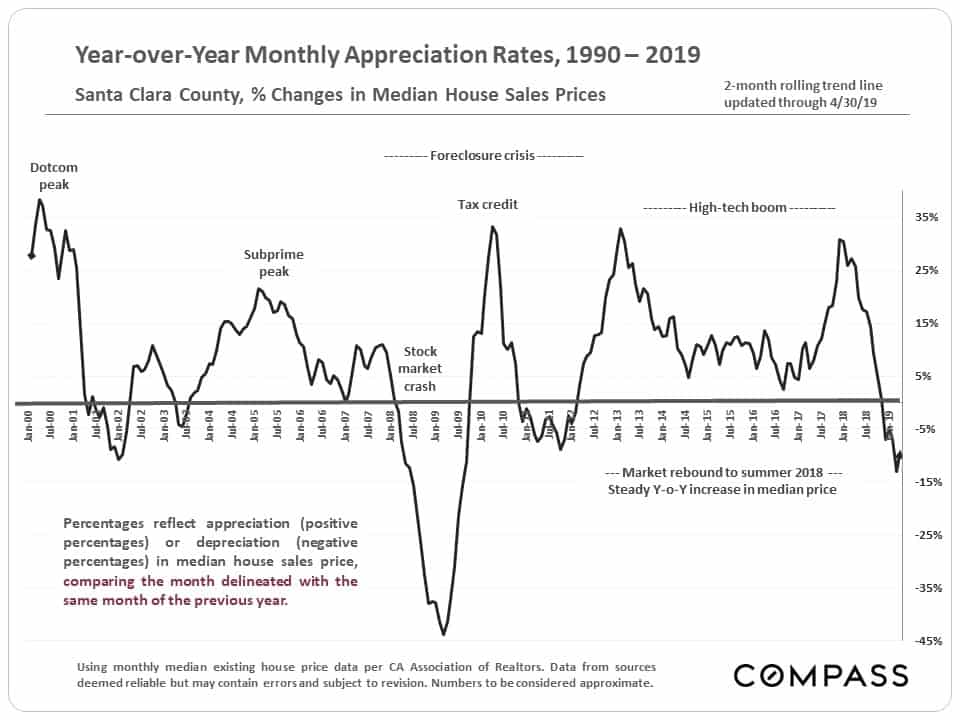
Year-over-Year, Monthly Median Home Price Appreciation Rates since 1990
A look back at longer-term trends in year-over-year, median house sales price appreciation rates.
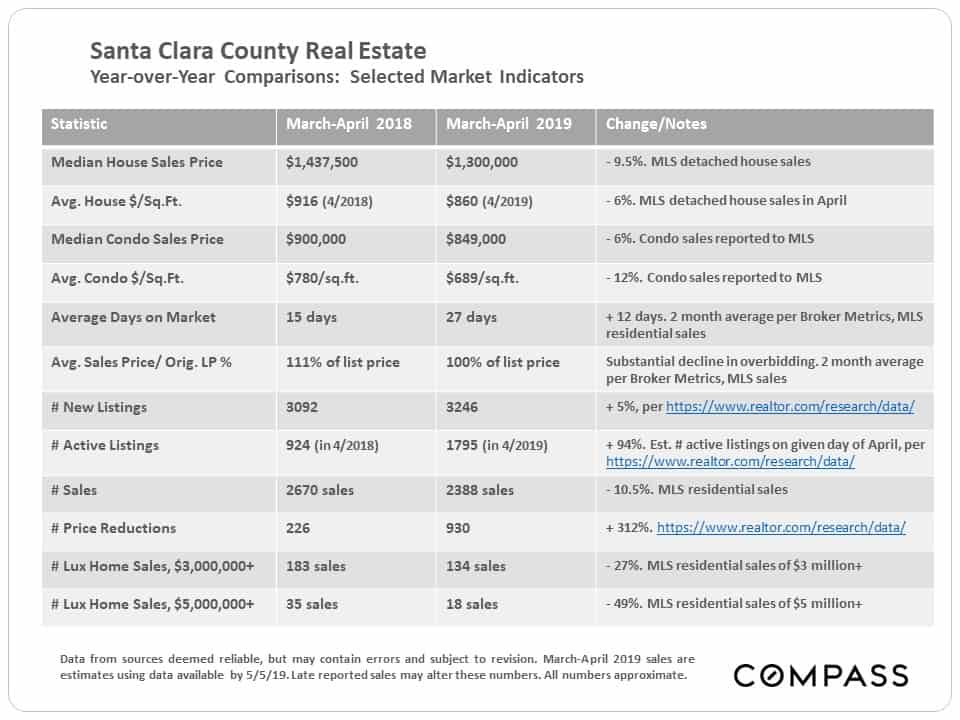
This table compares the March-April market statistics of 2018 and 2019. By virtually every measure, the beginning of this year’s spring market is considerably less intense than last year’s.
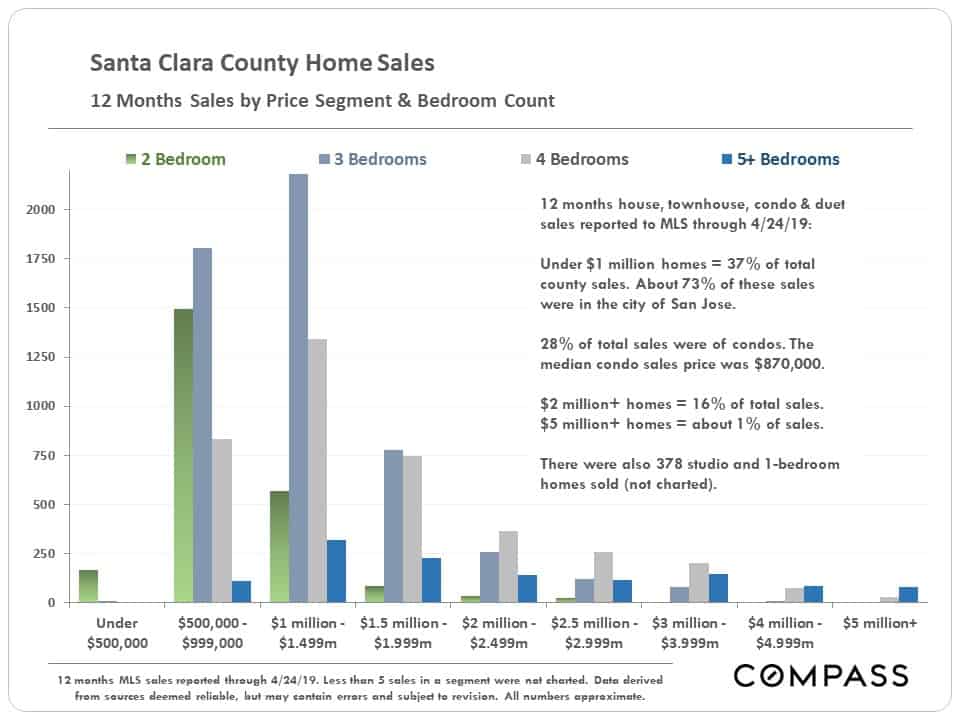
Home Sales by Price Segment & Bedroom Count
An illustration of the last 12 months of house, townhouse and condo sales broken out by price range and number of bedrooms. These are spread among a large number of very different markets within the county.
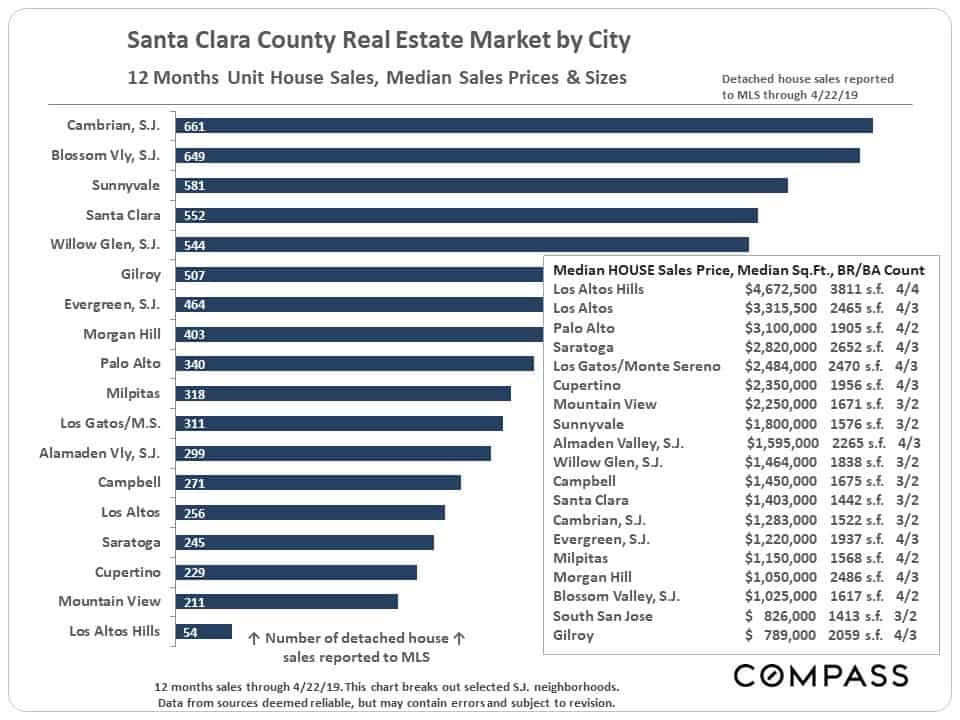
Home Sales, Sizes and Values by City
San Jose, of course, is the giant market in the county, but in the next chart we break out some of its individual neighborhoods instead.
Below is an illustration of the number of house sales over the past 12 months, the median house sales price, median square footage and median bedroom/ bathroom count for each market.
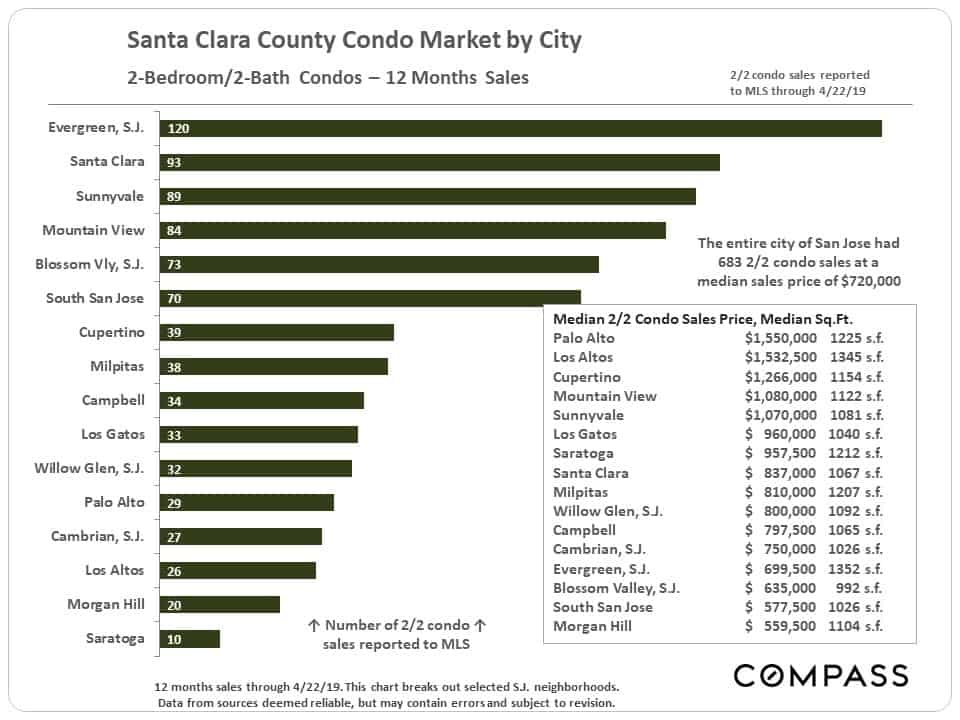
A look specifically at 2-bedroom/ 2 bath condo sales, median sales prices, and median unit square footage by market.
Luxury Homes Markets
Sales Volumes, Values and Sizes by City –
Santa Clara & San Mateo Counties
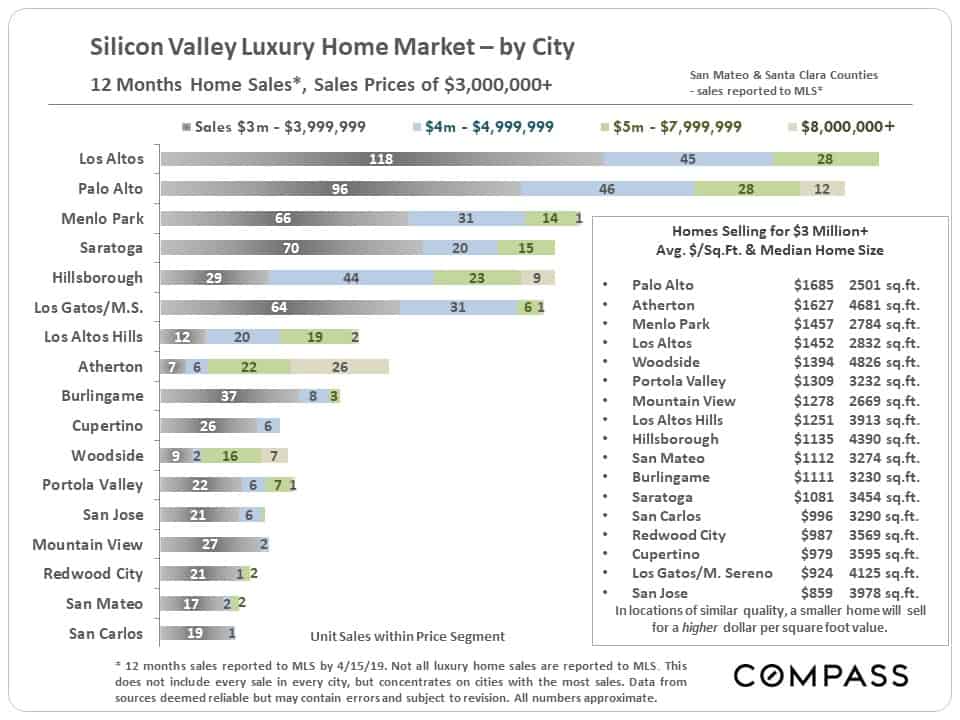
We typically define the luxury home threshold at sales prices of $3,000,000 and above. Of course, what one gets for that price varies enormously in different locations. Silicon Valley has the largest luxury home market in California.
Q1 2019 Ultra-Luxury Market, Santa Clara County
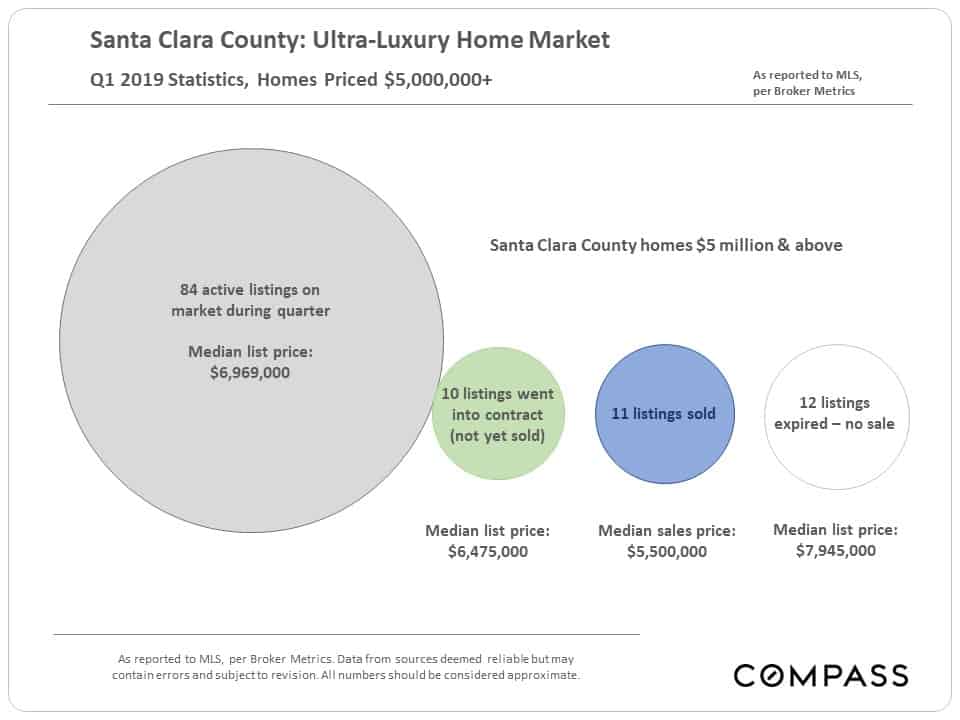
The “ultra-luxury” segment begins at sales prices of $5 million. Below is a snapshot of Q1 2019 statistics in Santa Clara County, illustrating a somewhat soft dynamic of relatively high inventory as compared to the rate of sales. Note the differential between median list prices, sales prices, and the median price of those listings that expired without selling.
Q2 is typically the biggest quarter of the year for high-price home sales.
Median House Size & Era of Construction
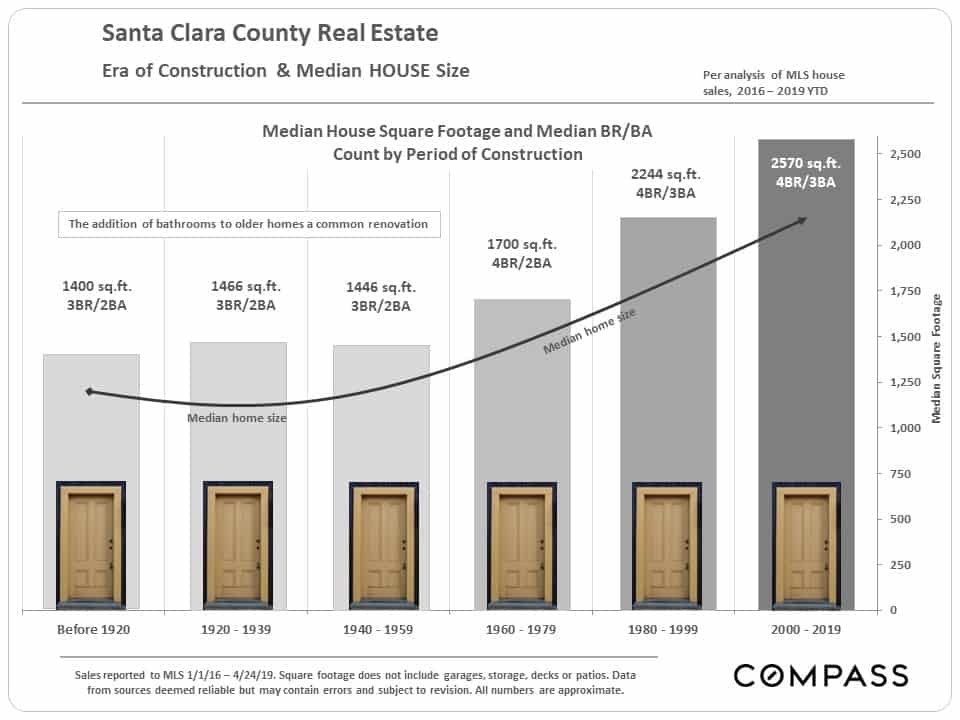
Many factors influence home construction during any particular period: Affluence, economic conditions (high-tech booms), household size, buyer age, land costs, population growth, highway construction, natural disasters, etc. Generally speaking, the median size of Santa Clara County houses built in the first half of the 20th century were smaller, but then started to increase rapidly until hitting a new peak since 2000. This overall trend coincided with the population explosion that began in the 1940’s.
Over the past few decades, condos – built in increasing numbers – have become a major alternative for people purchasing homes of smaller size.
Selected Demographic & Economic Factors
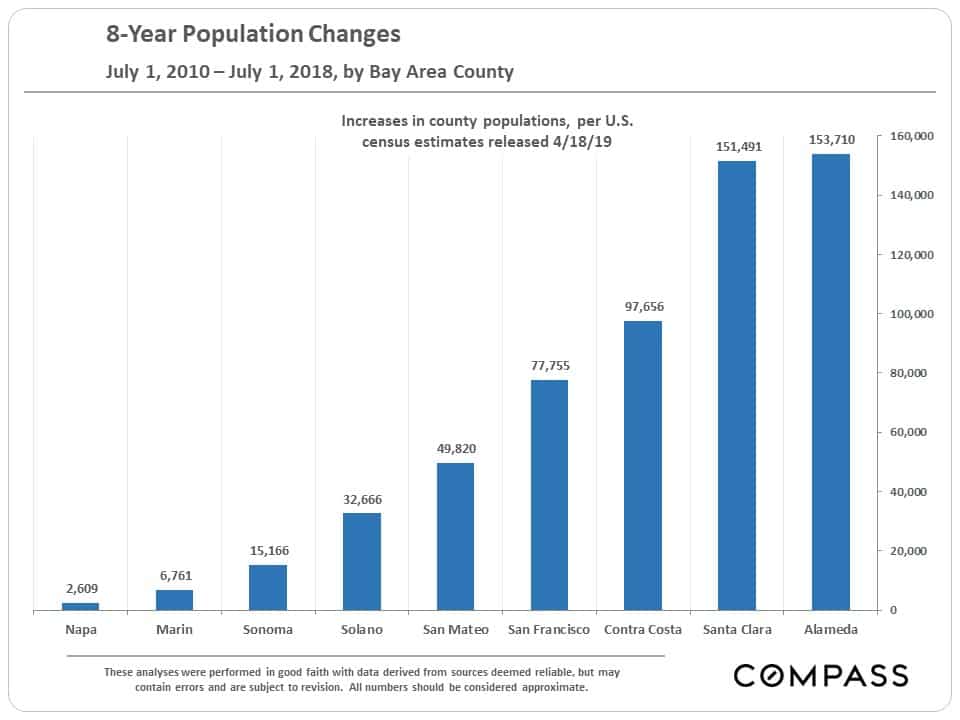
Population Growth
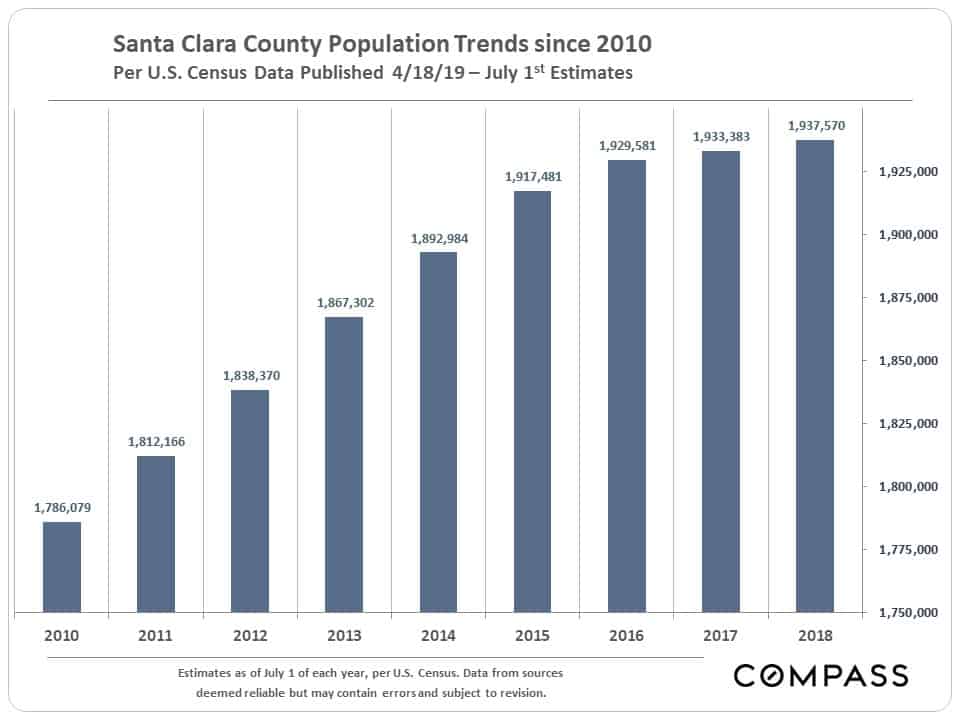
New census figures have just been released: The latest surge in county population began 10 years ago with big increases through 2016, increases which paralleled the tremendous jump in high-tech hiring. However, in the last 2 years through mid-2018, annual growth figures began to markedly slow.
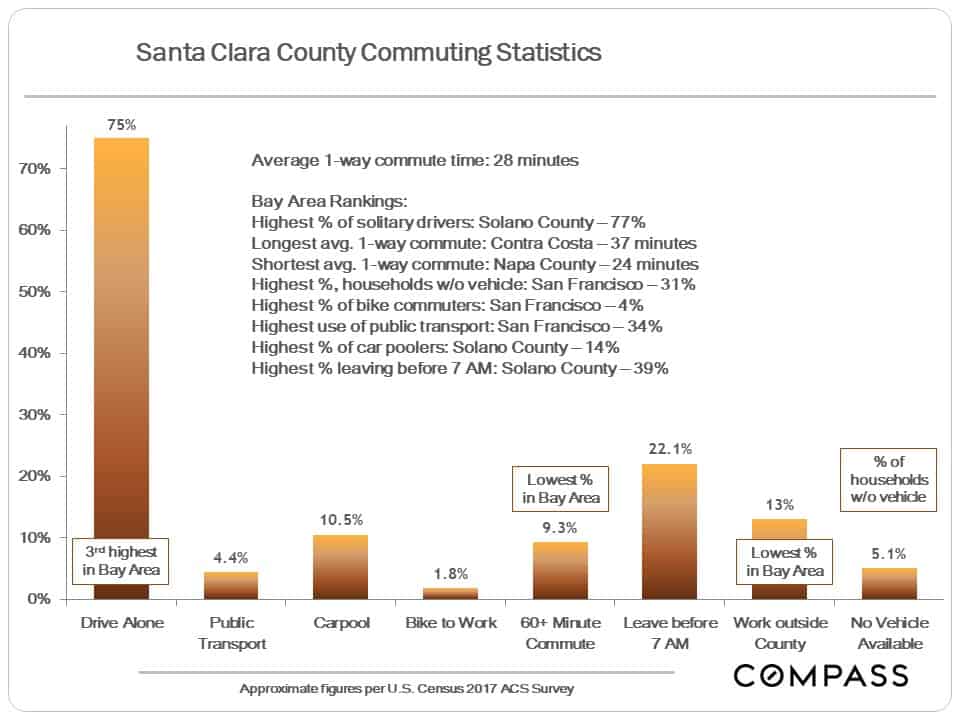
Commuting
Venture Capital Flow
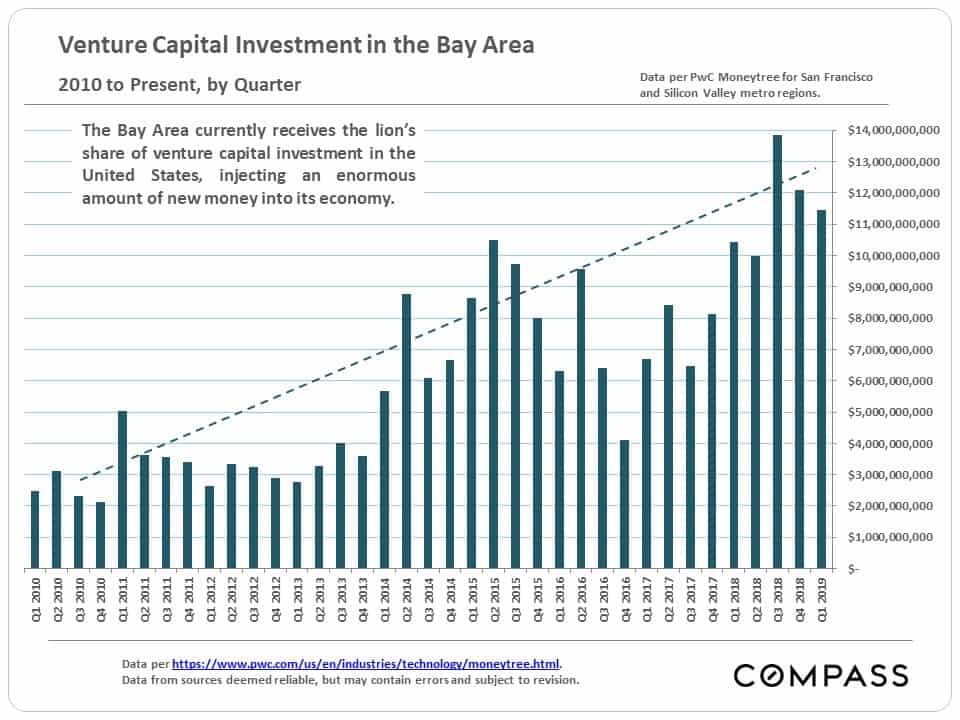
In recent years, the Bay Area has been the biggest destination of venture capital investment dollars in the country – and probably the world. These tens of billions of dollars have constituted a massive factor in the local economy, supercharging the creation of new companies, hiring, and, eventually, IPOs. Ultimately, venture capital is seed money that in the last decade has exploded into the creation of stupendous amounts of new wealth.
